Amos' Visual Analytics Blog
Visual Analytics Project
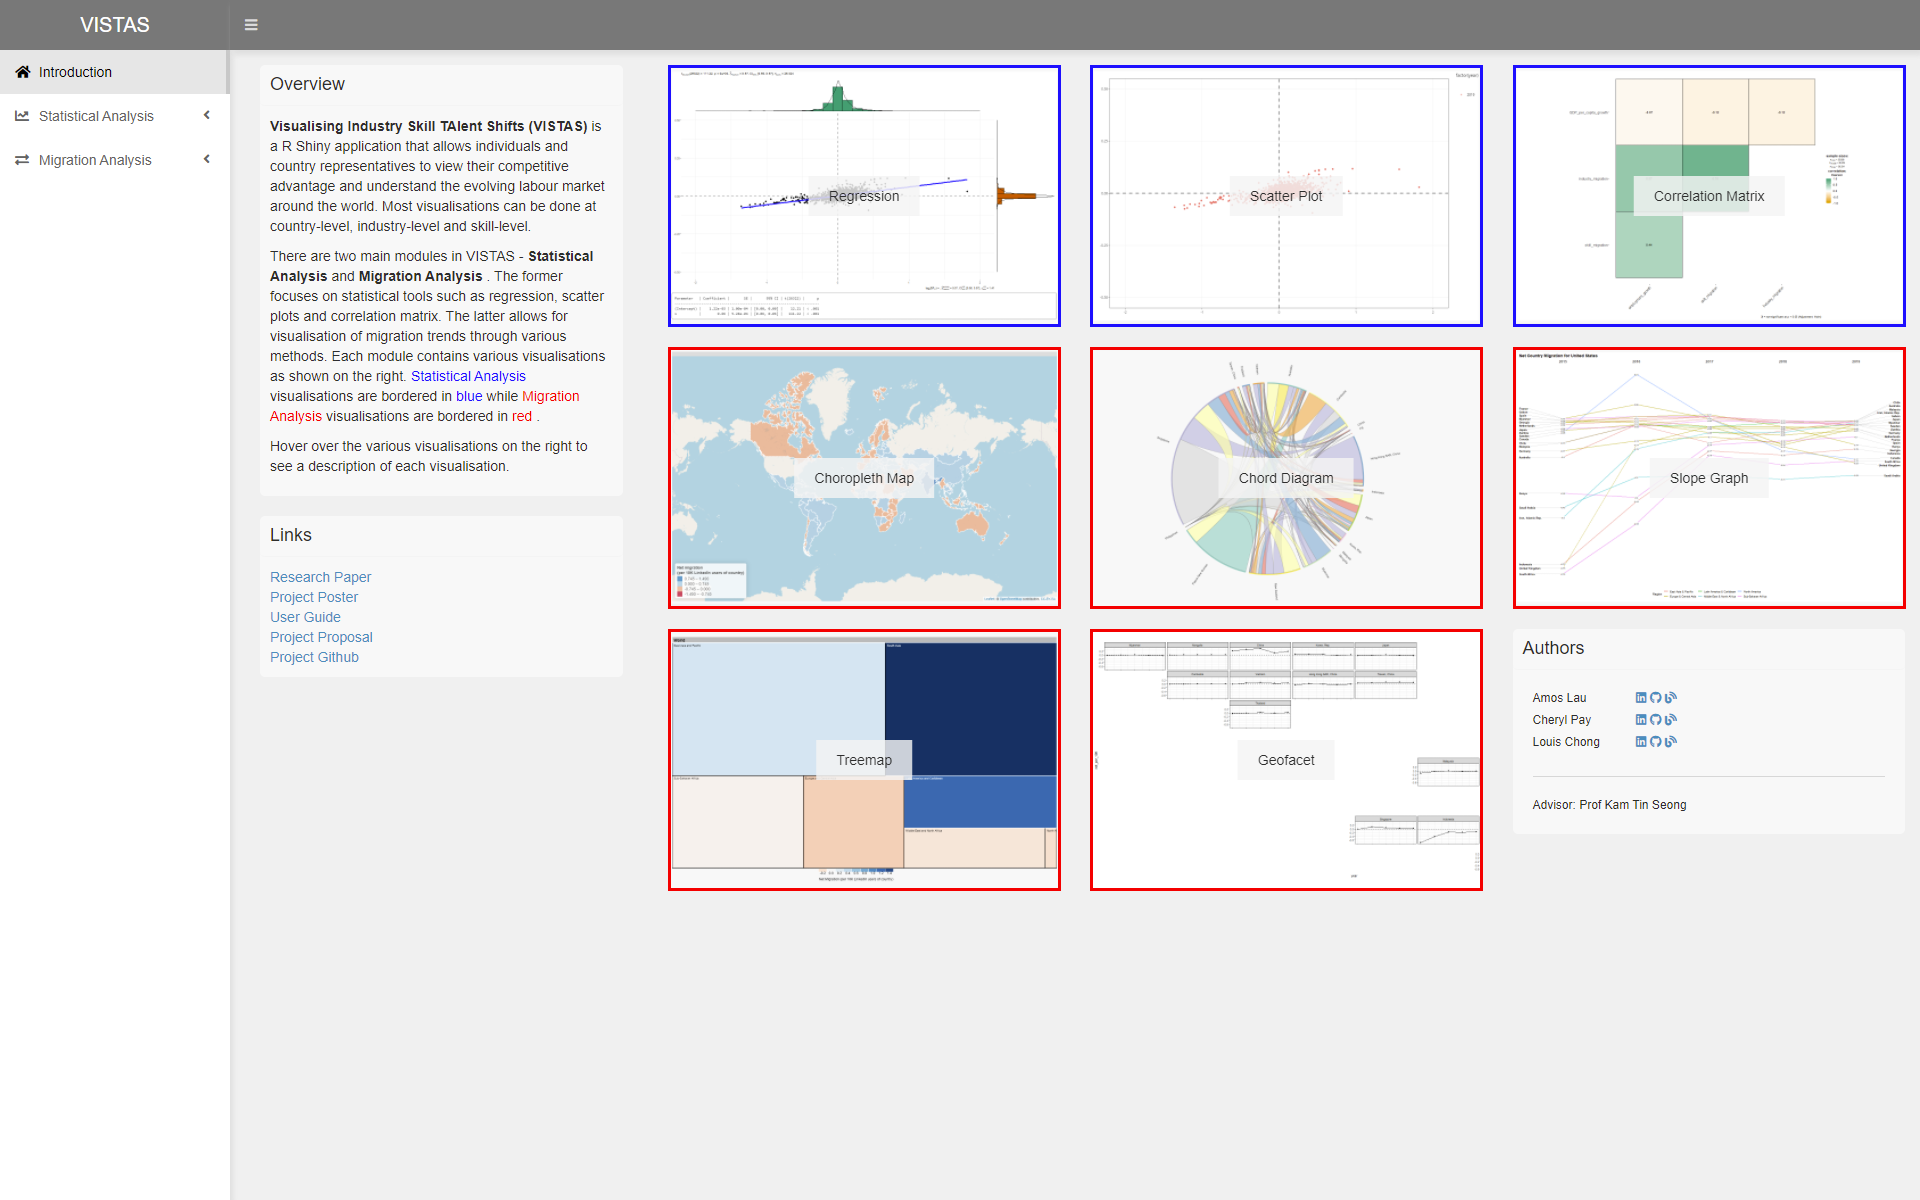
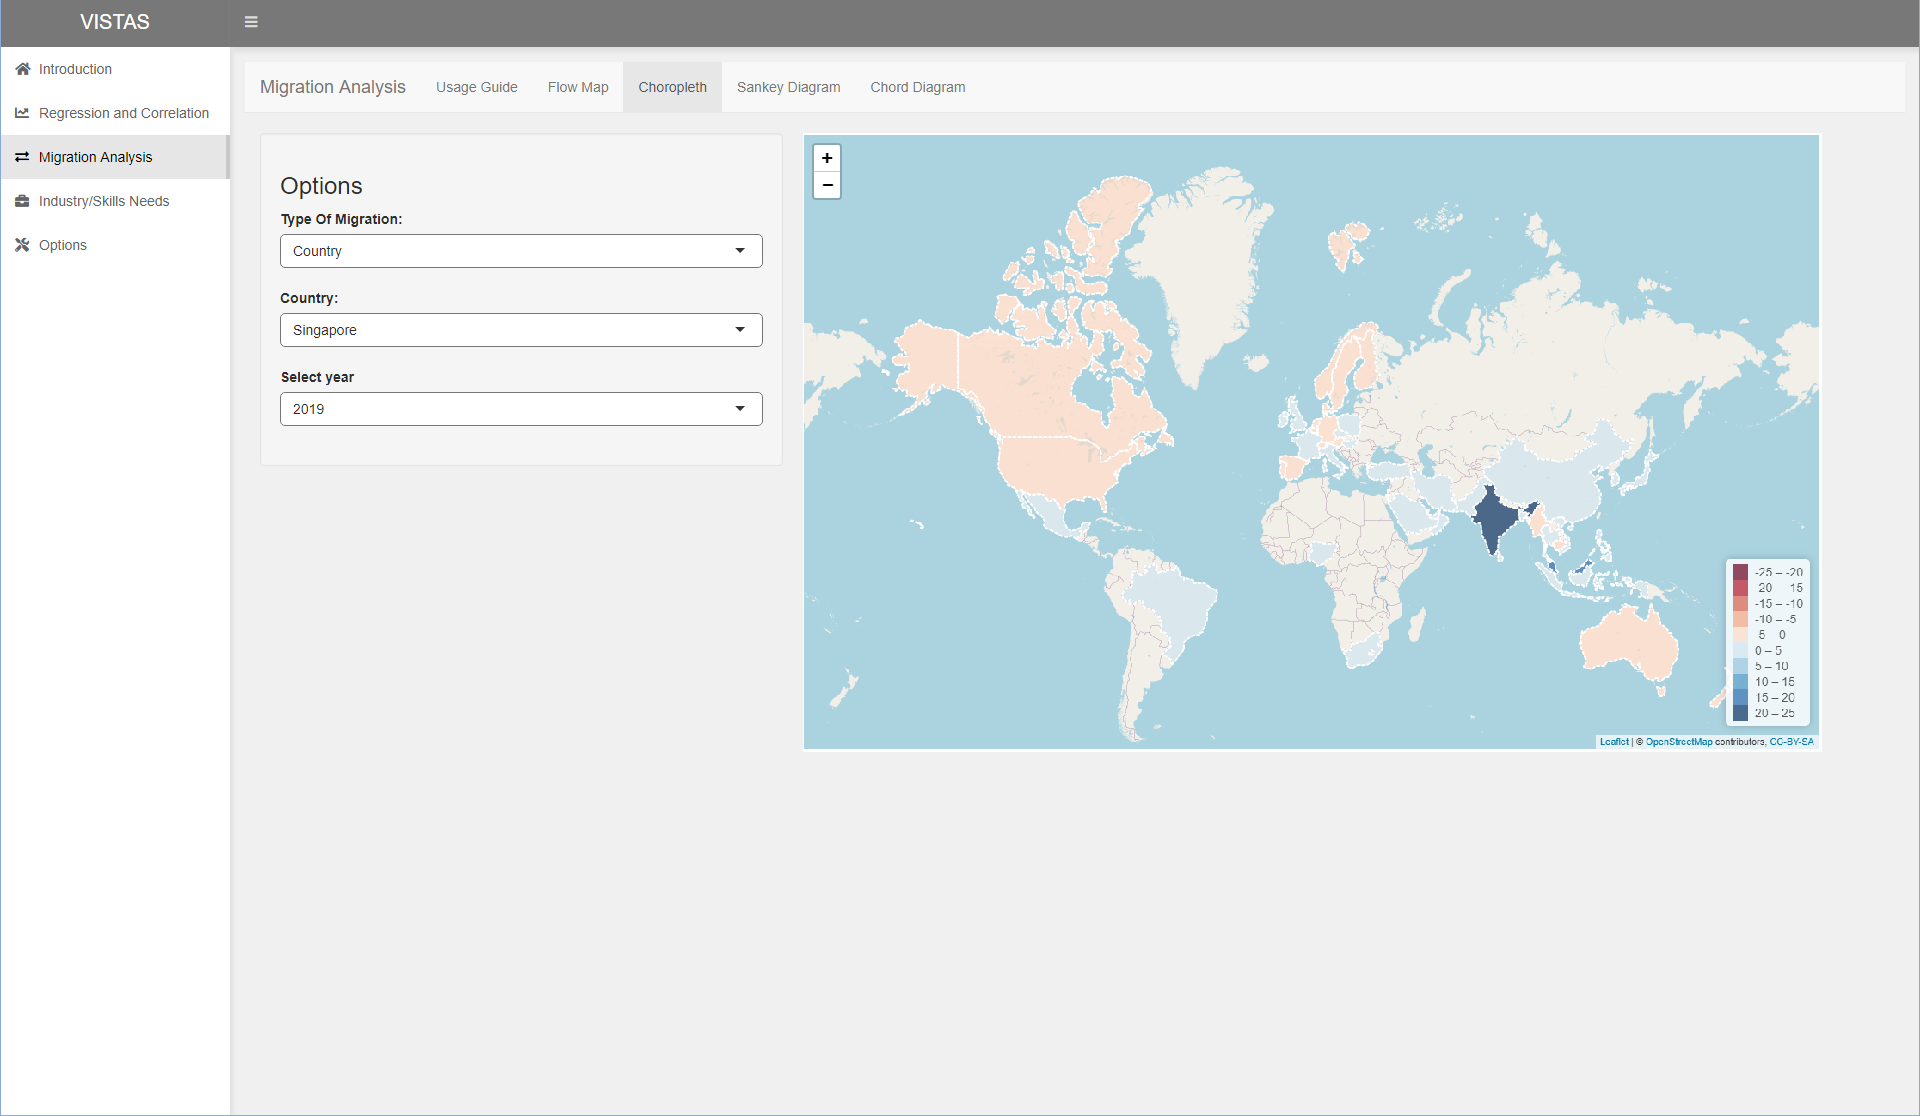
This post provides an overview of our project VISTAS (Visualising Industry Skill TAlent Shifts) as well as links to the application, proposal, poster, research paper and Github repository.
Visual Analytics Assignment - Visualising Country, Skill and Industry Migration
This report is part of a group project for our visual analytics module. Our project is titled VISTAS - Visualising Industry Skill TAlent Shifts. Each group member is tasked with completing a sub-module of the final group project.
DataViz Makeover 3
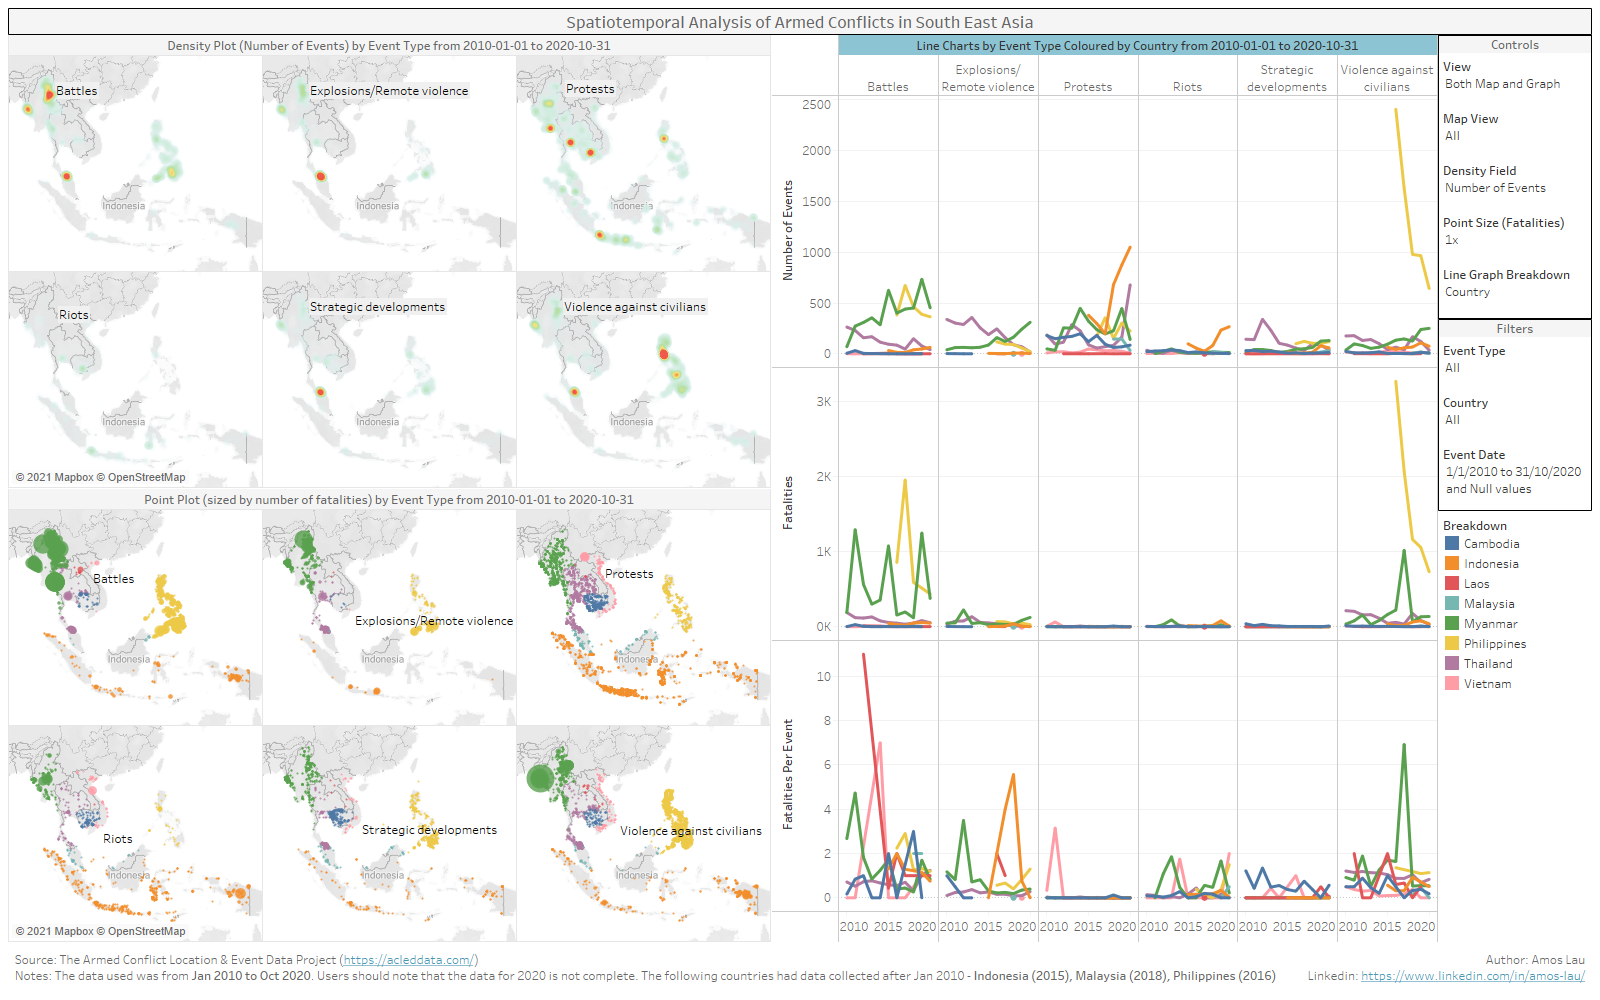
This post will be looking at an interactive data visualisation created to reveal the spatio-temporal patterns of armed conflict in selected South-east Asia countries between 2010-2020 and to identify possible areas of improvement.
Visual Analytics Project Proposal
This post contains the proposal for our Visual Analytics Project titled VISTAS - Visualising Industry Skill TAlent Shifts.
DataViz Makeover 2
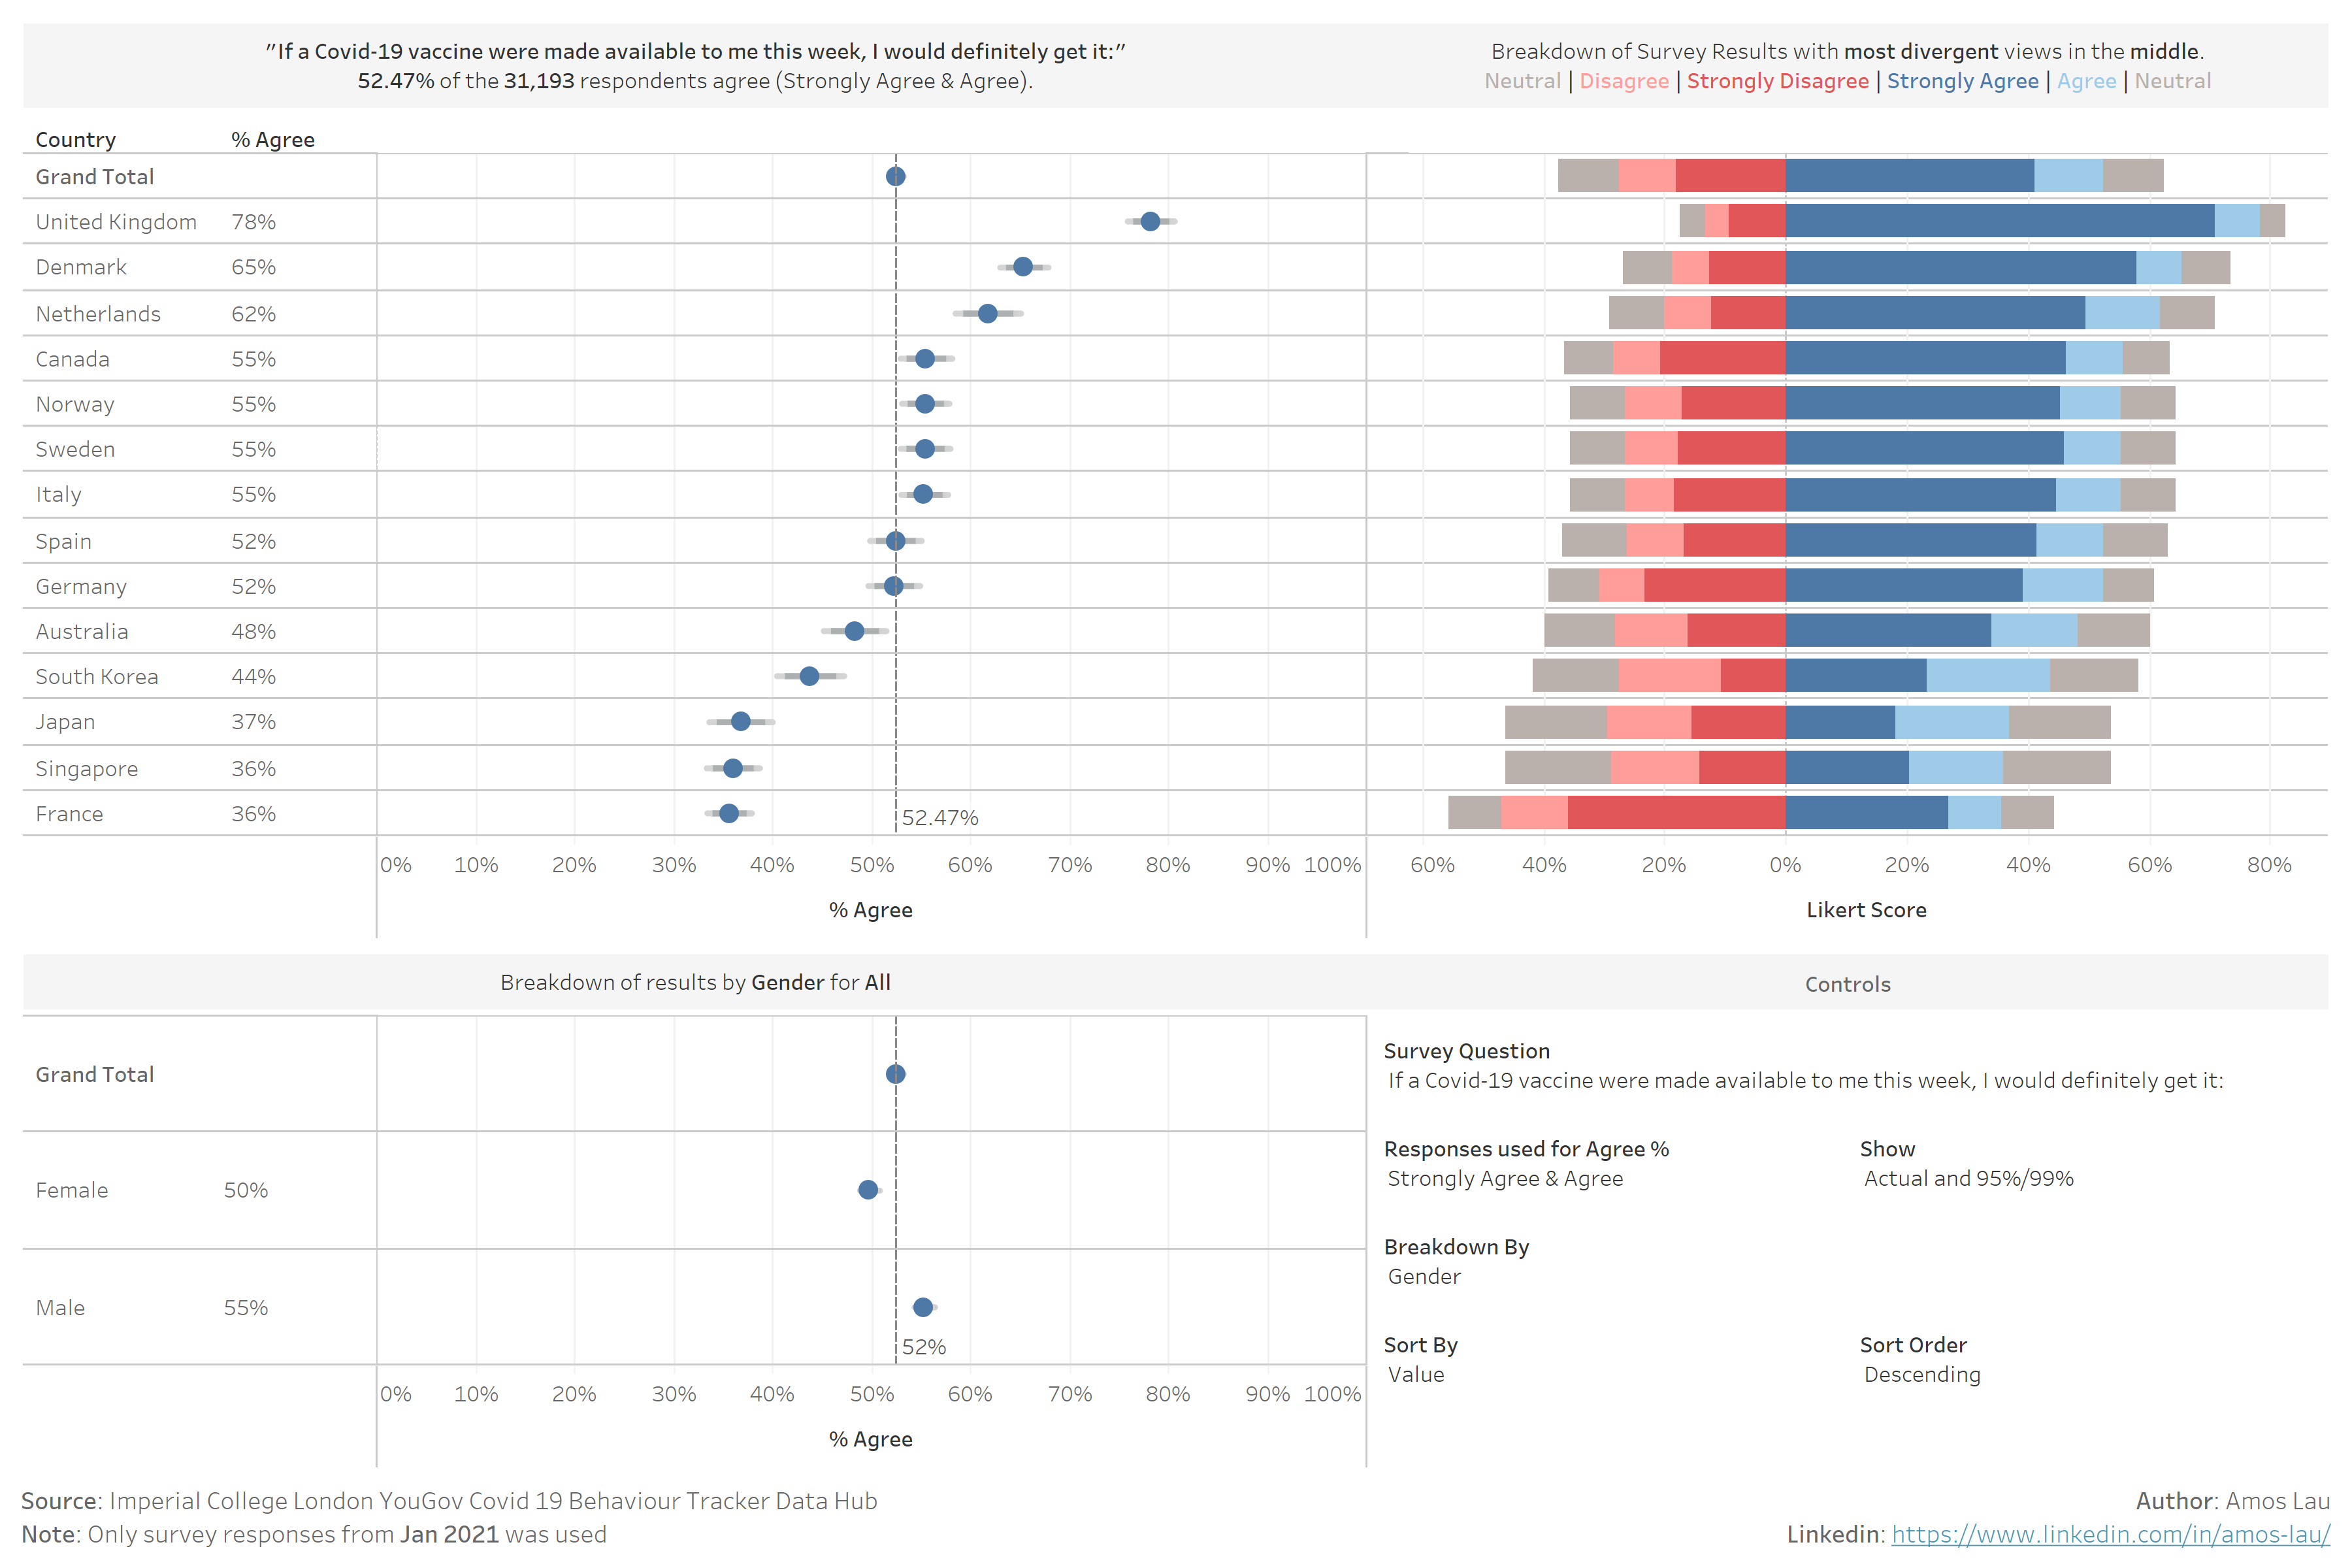
This post will be looking at two data visualisations created by a research scientist of a research team conducting a study to understand the willingness of the public to take COVID-19 vaccinations.
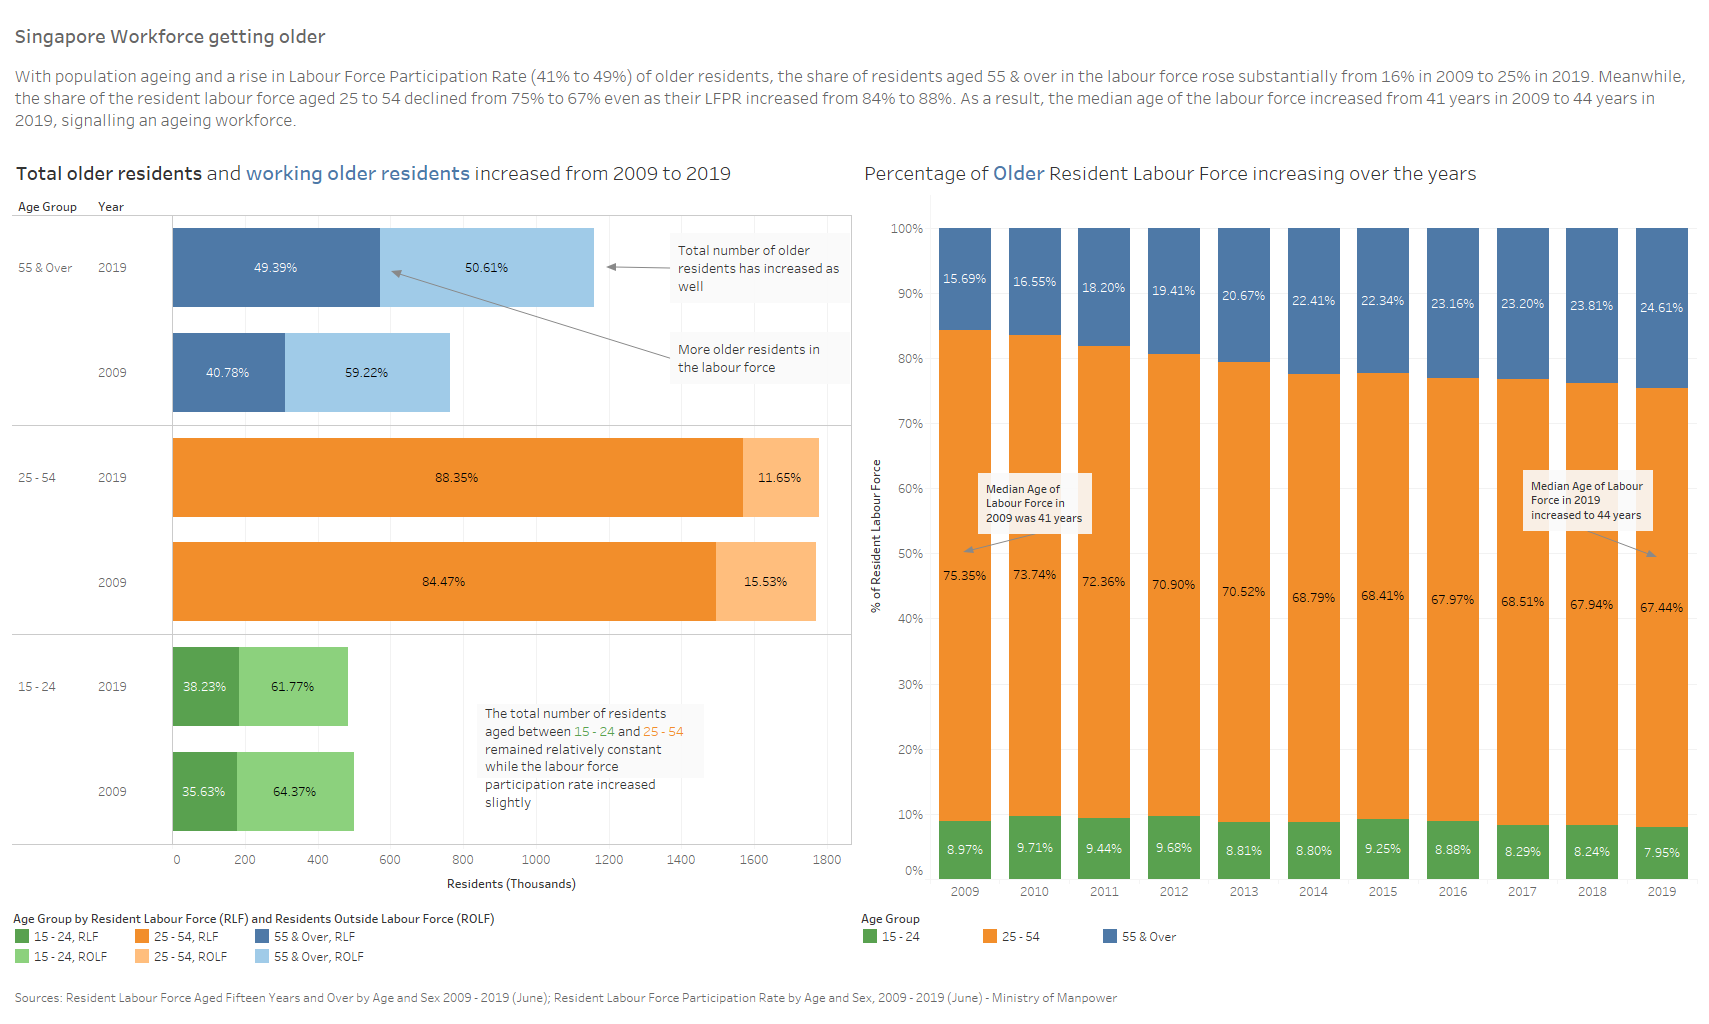
DataViz Makeover 1
This post will be looking at Chart 6 Resident labour force by age in MOM's Report: Labour Force in Singapore 2019 to see if there are possible areas of improvement and come up with a proposed visualisation to improve on those areas.
Welcome to Amos' Visual Analytics Blog
Welcome to my blog. This blog was started for my masters module on Visual Analytics, and will be updated as and when I find other interesting things to write on.