This post provides an overview of our project VISTAS (Visualising Industry Skill TAlent Shifts) as well as links to the application, proposal, poster, research paper and Github repository.
Overview of Project
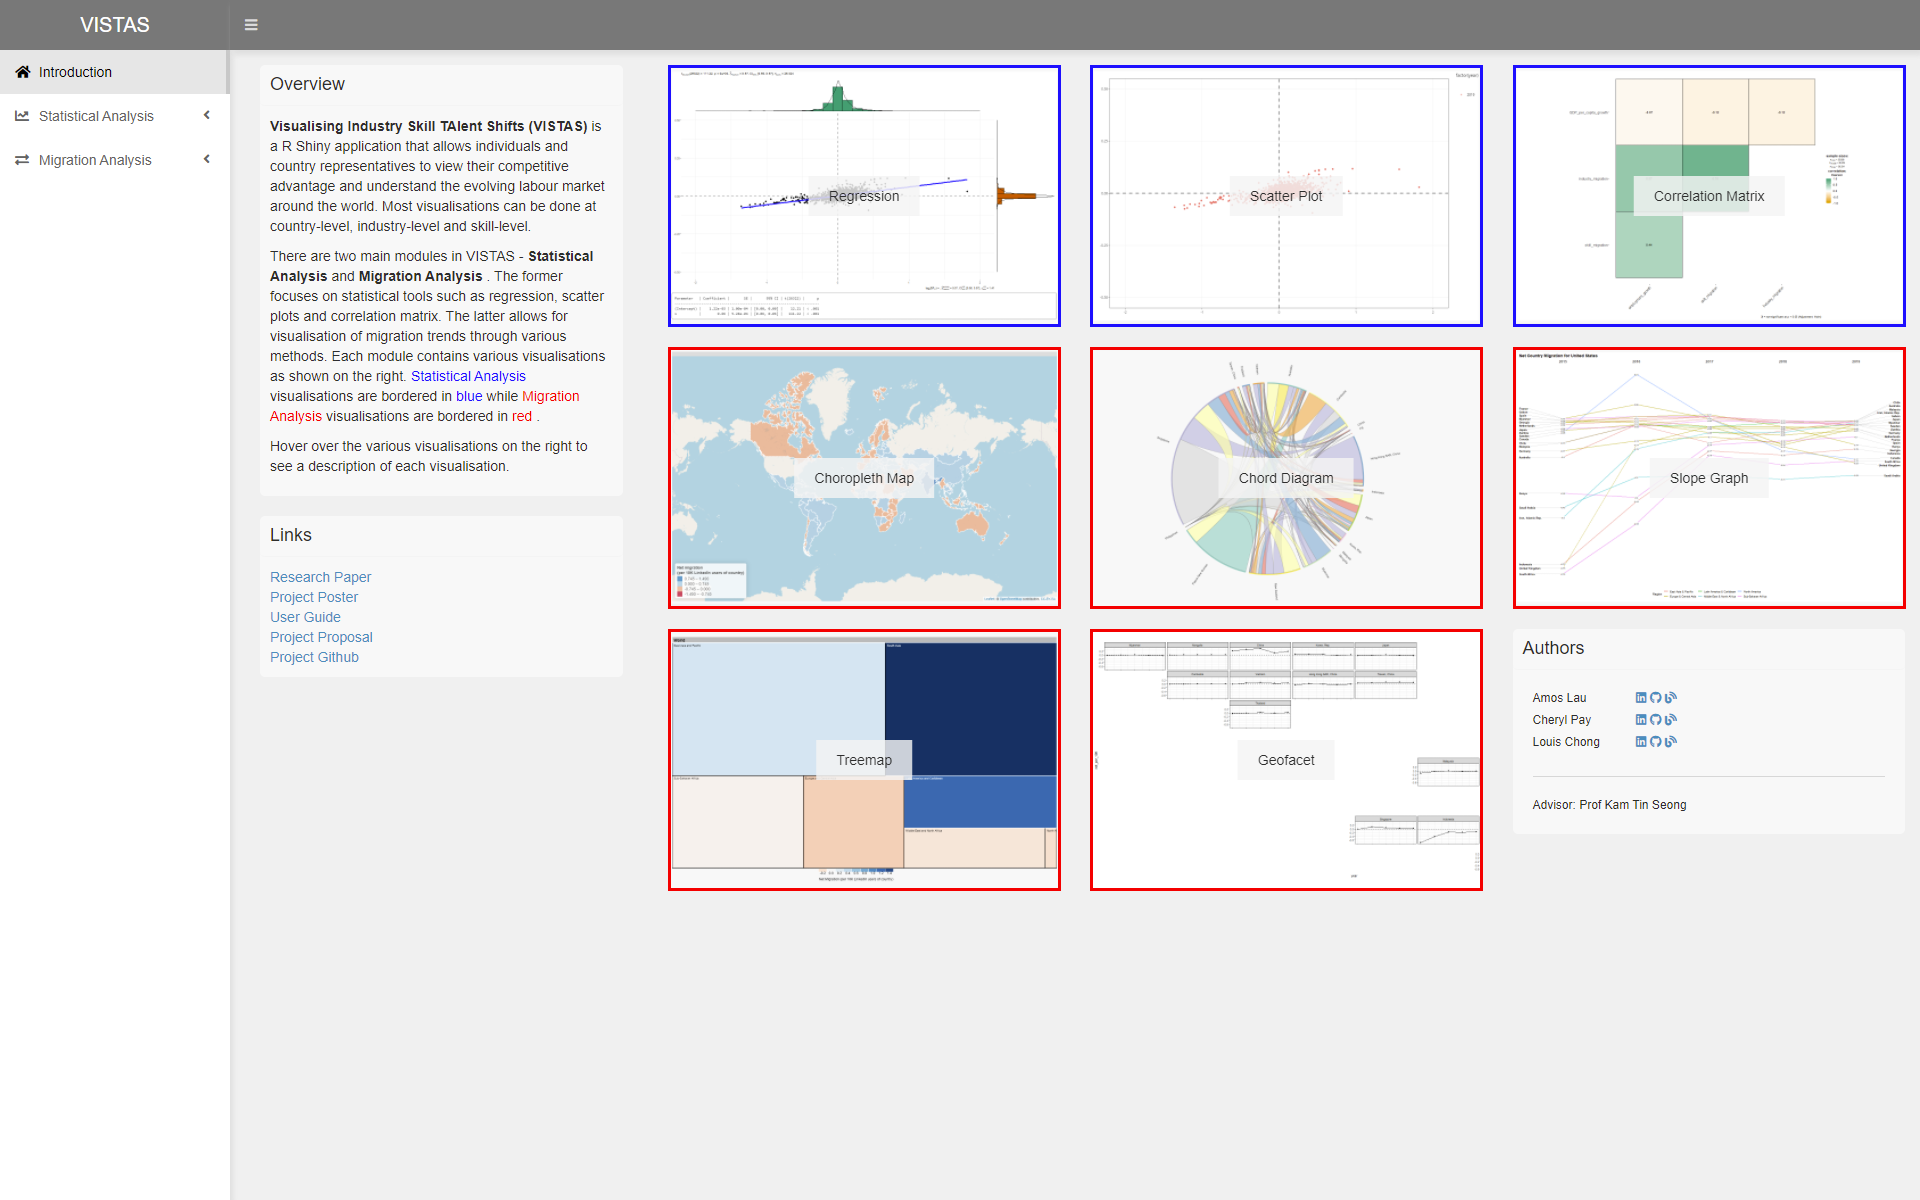
Numerous studies have been conducted to analyse the impact of employment growth and migration on GDP per capita. However, these studies usually use datasets aggregated at country level. More can be done to deep dive into the relationship between GDP per capita, employment growth and migration within each industry to help individuals and countries better understand the rapidly evolving labour market and its impact on country’s economic growth. LinkedIn and World Bank Group have partnered to release a useful set of data from 2015 to 2019 on the employment growth and migration for different industries and skills in various countries. Together with GDP per capita data for each country, countries can study the impact of employment growth and migration for each industry and skill on GDP per capita, find out which are the key skills and whether they have been gained or lost to other countries. At the same time, individuals can analyse the labour market, identify the highly sought-after skills and countries that hold better employment opportunities for each skill. This boosts the competitive edge of countries and individuals in the labour market. To aid individuals and countries in the study, we have designed and developed VISTAS (Visualising Industry Skill TAlent Shifts), an interactive and user-friendly visual analytics dashboard.
Proposal
Our proposal for VISTAS - Visualising Industry Skill TAlent Shifts can be found here.
In the post, you can find the background, project motivation and earlier sketches of our project. The final shiny dashboard differs as we explored more R packages with greater interactivity and added them into our app to create a user-friendly analytical tool.
Poster
Our poster, created using posterdown in Rmarkdown is available here. It shows all the visualisation types we have in our app and includes Singapore as a Case Study to showcase insights that can be gathered by using VISTAS.
Research Paper
The research report available for download here covers an in-depth introduction to the system architecture of our app and the limitations of certain packages that we have used. Insights for our case study on Singapore are also discussed.
Application
VISTAS is available at https://moomookau.shinyapps.io/VISTAS/ for you to explore.
Github
All codes for the application and various artifacts can be found at our project Github at https://github.com/moomookau/VISTAS/.
Acknowledgements
We would like to thank Prof Kam for his valuable guidance and patience.